
Introduction
Unquork was looking to improve internal operations to run the business effectively.
Since they were relying on Excel with manual processes, which has been time-consuming and often get lost.
This project was 20 weeks of engagement, including Financial Analysis, Resourcing, Timesheet, Billing and Invoice.
Team
2 Designers
Project Manager
2 SMEs from the Financial and Operation Team
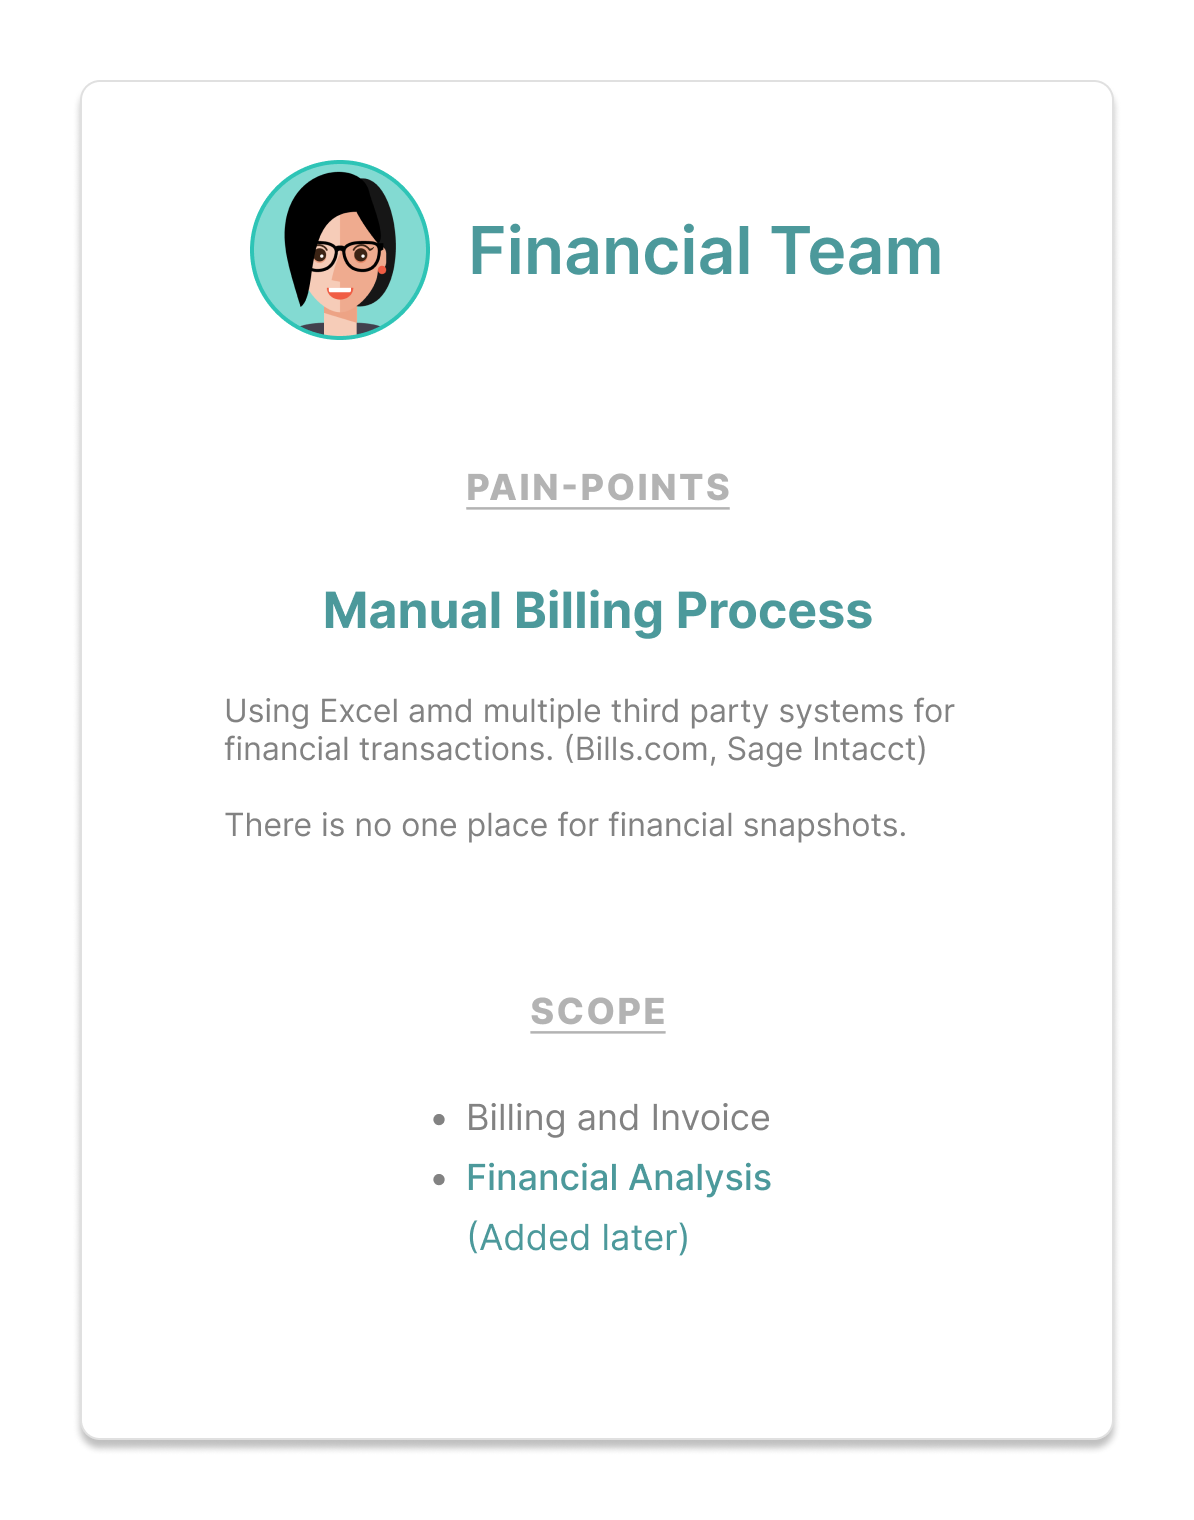
The Primary User
Internal Operation Team
Business Leadership (CEO, CFO, COO)
Internal Financial Team

User Interview
We conducted initial user interviews with six financial and operational team users to reveal the current process, user pain points, and the user needs to shape the product scope.
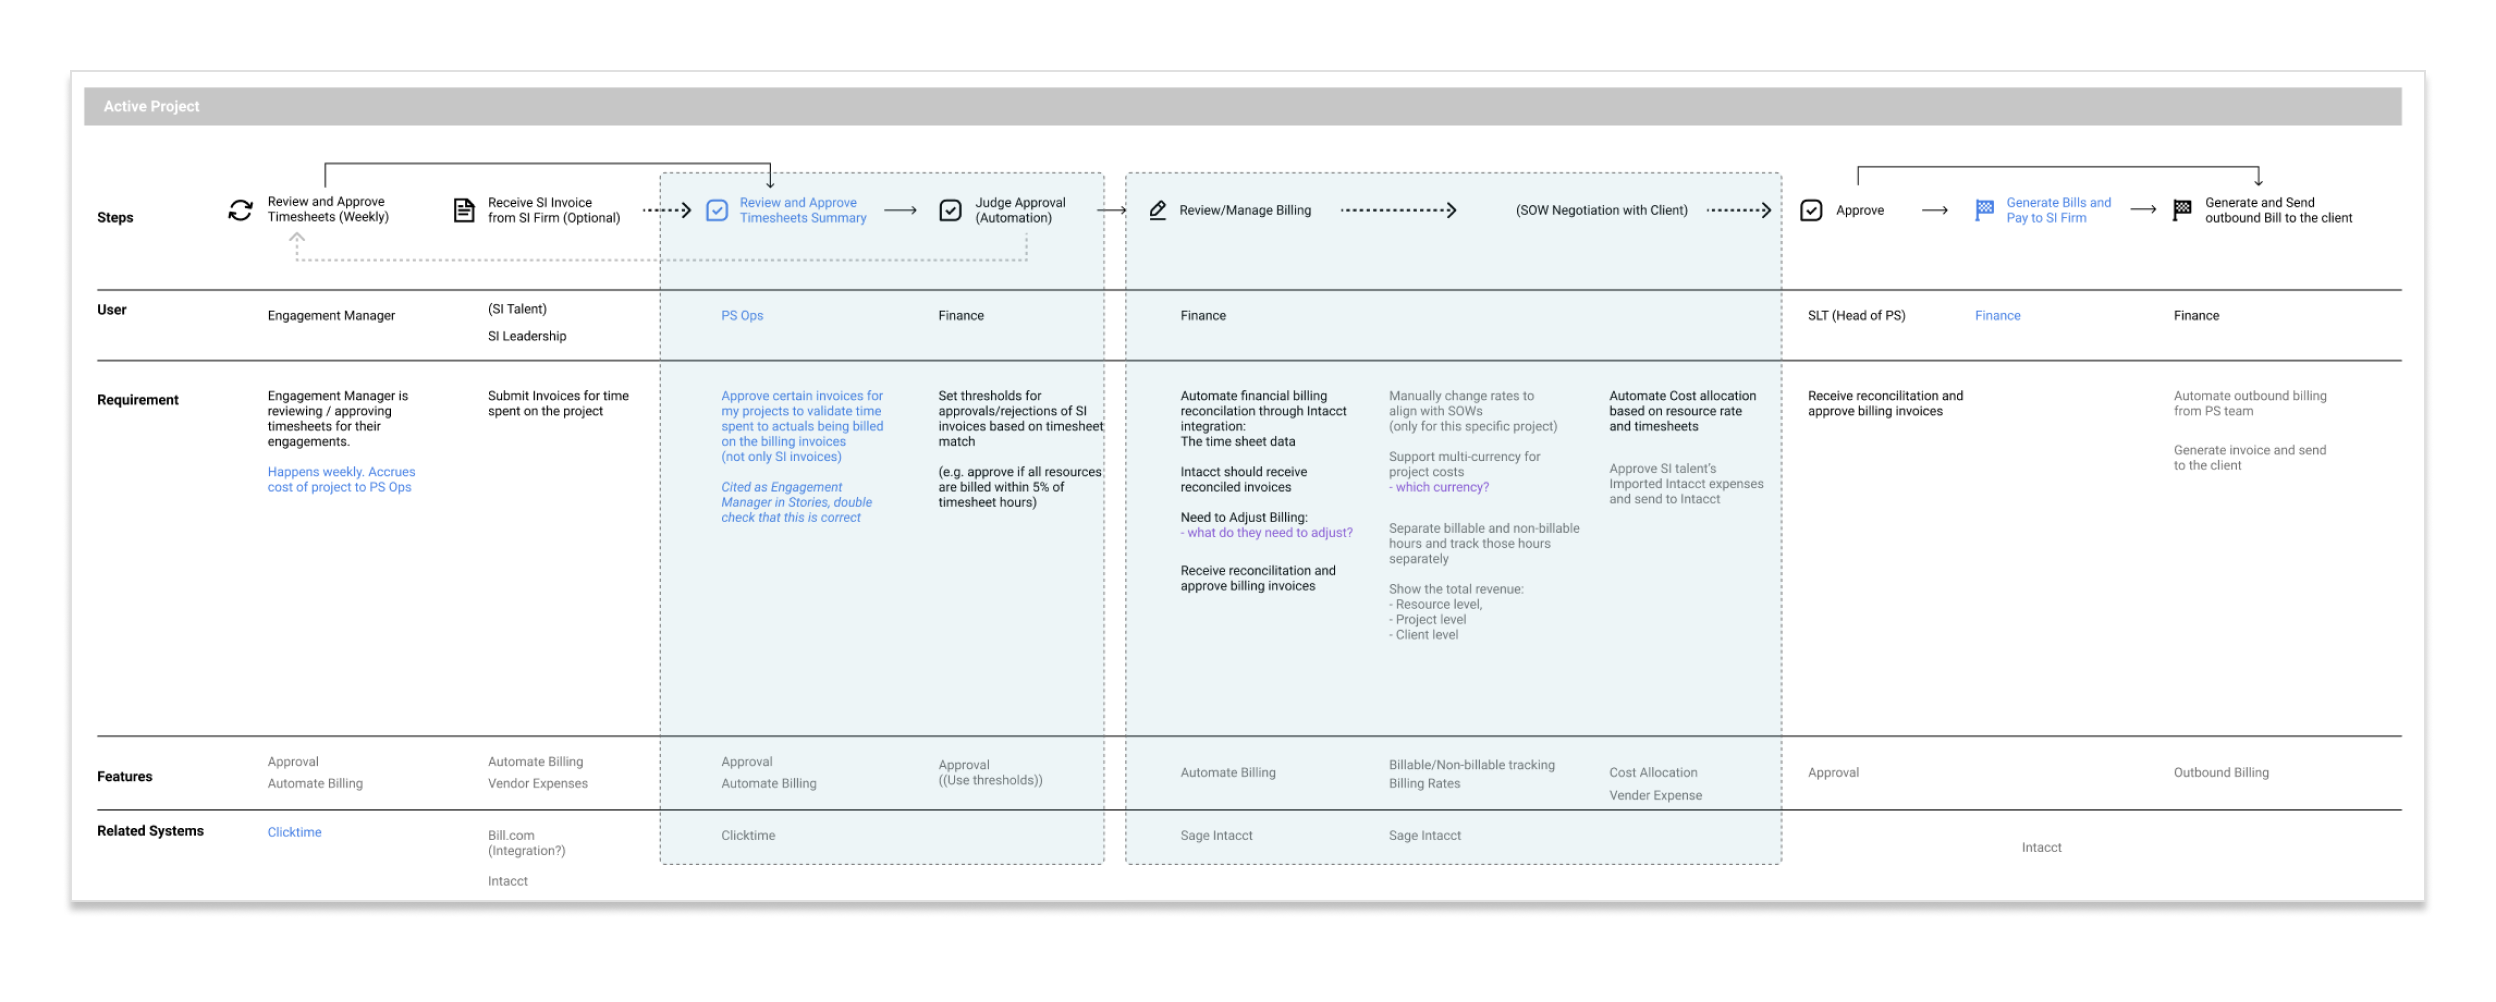
User Journey
Based on the findings from the user interviews, I created a user journey for Timesheet, Billing, and Invoice
to visualize the complicated flow and ensure our understanding is correct.
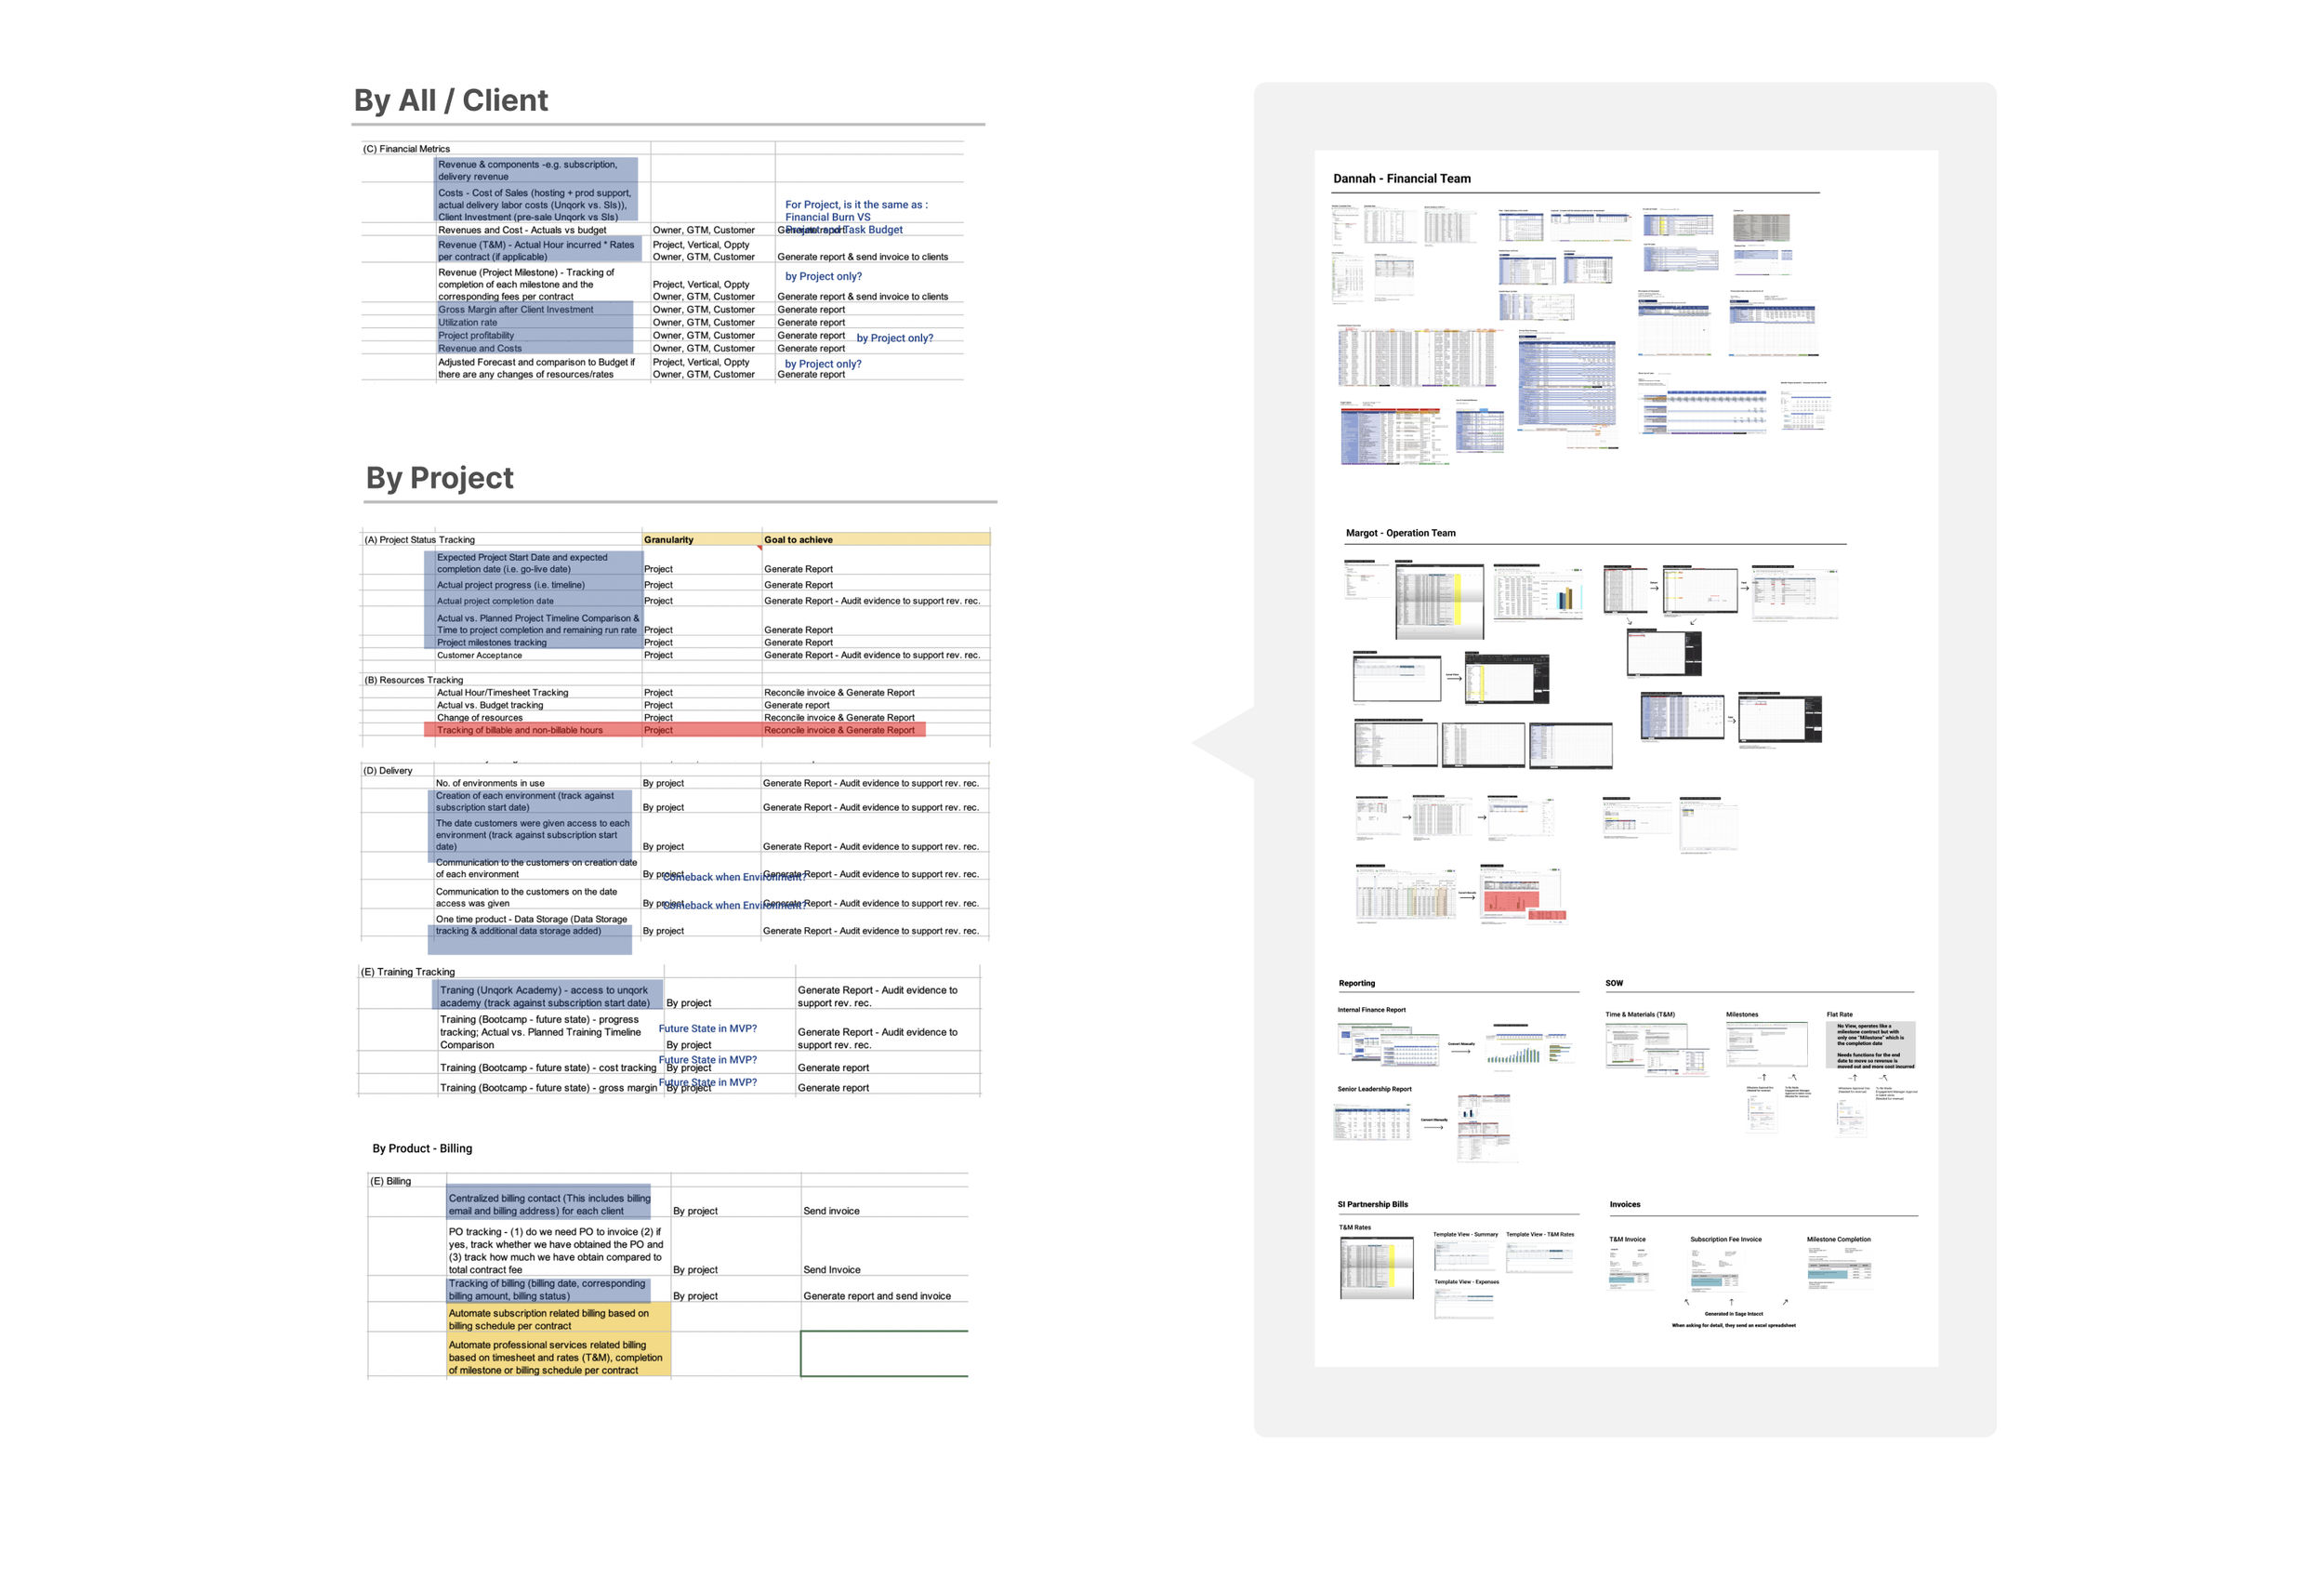
Requirement Gathering
I created the shared requirement cheat sheet for Financial Analysis to collaborate with SMEs and Stakeholders. I created the baseline from what we found in the user interviews and current flow walkthrough, then we all contributed to shaping the requirement scope together.
Proposed Sitemap
I created a high-level site map based on the initial user interviews, scope and requirements.

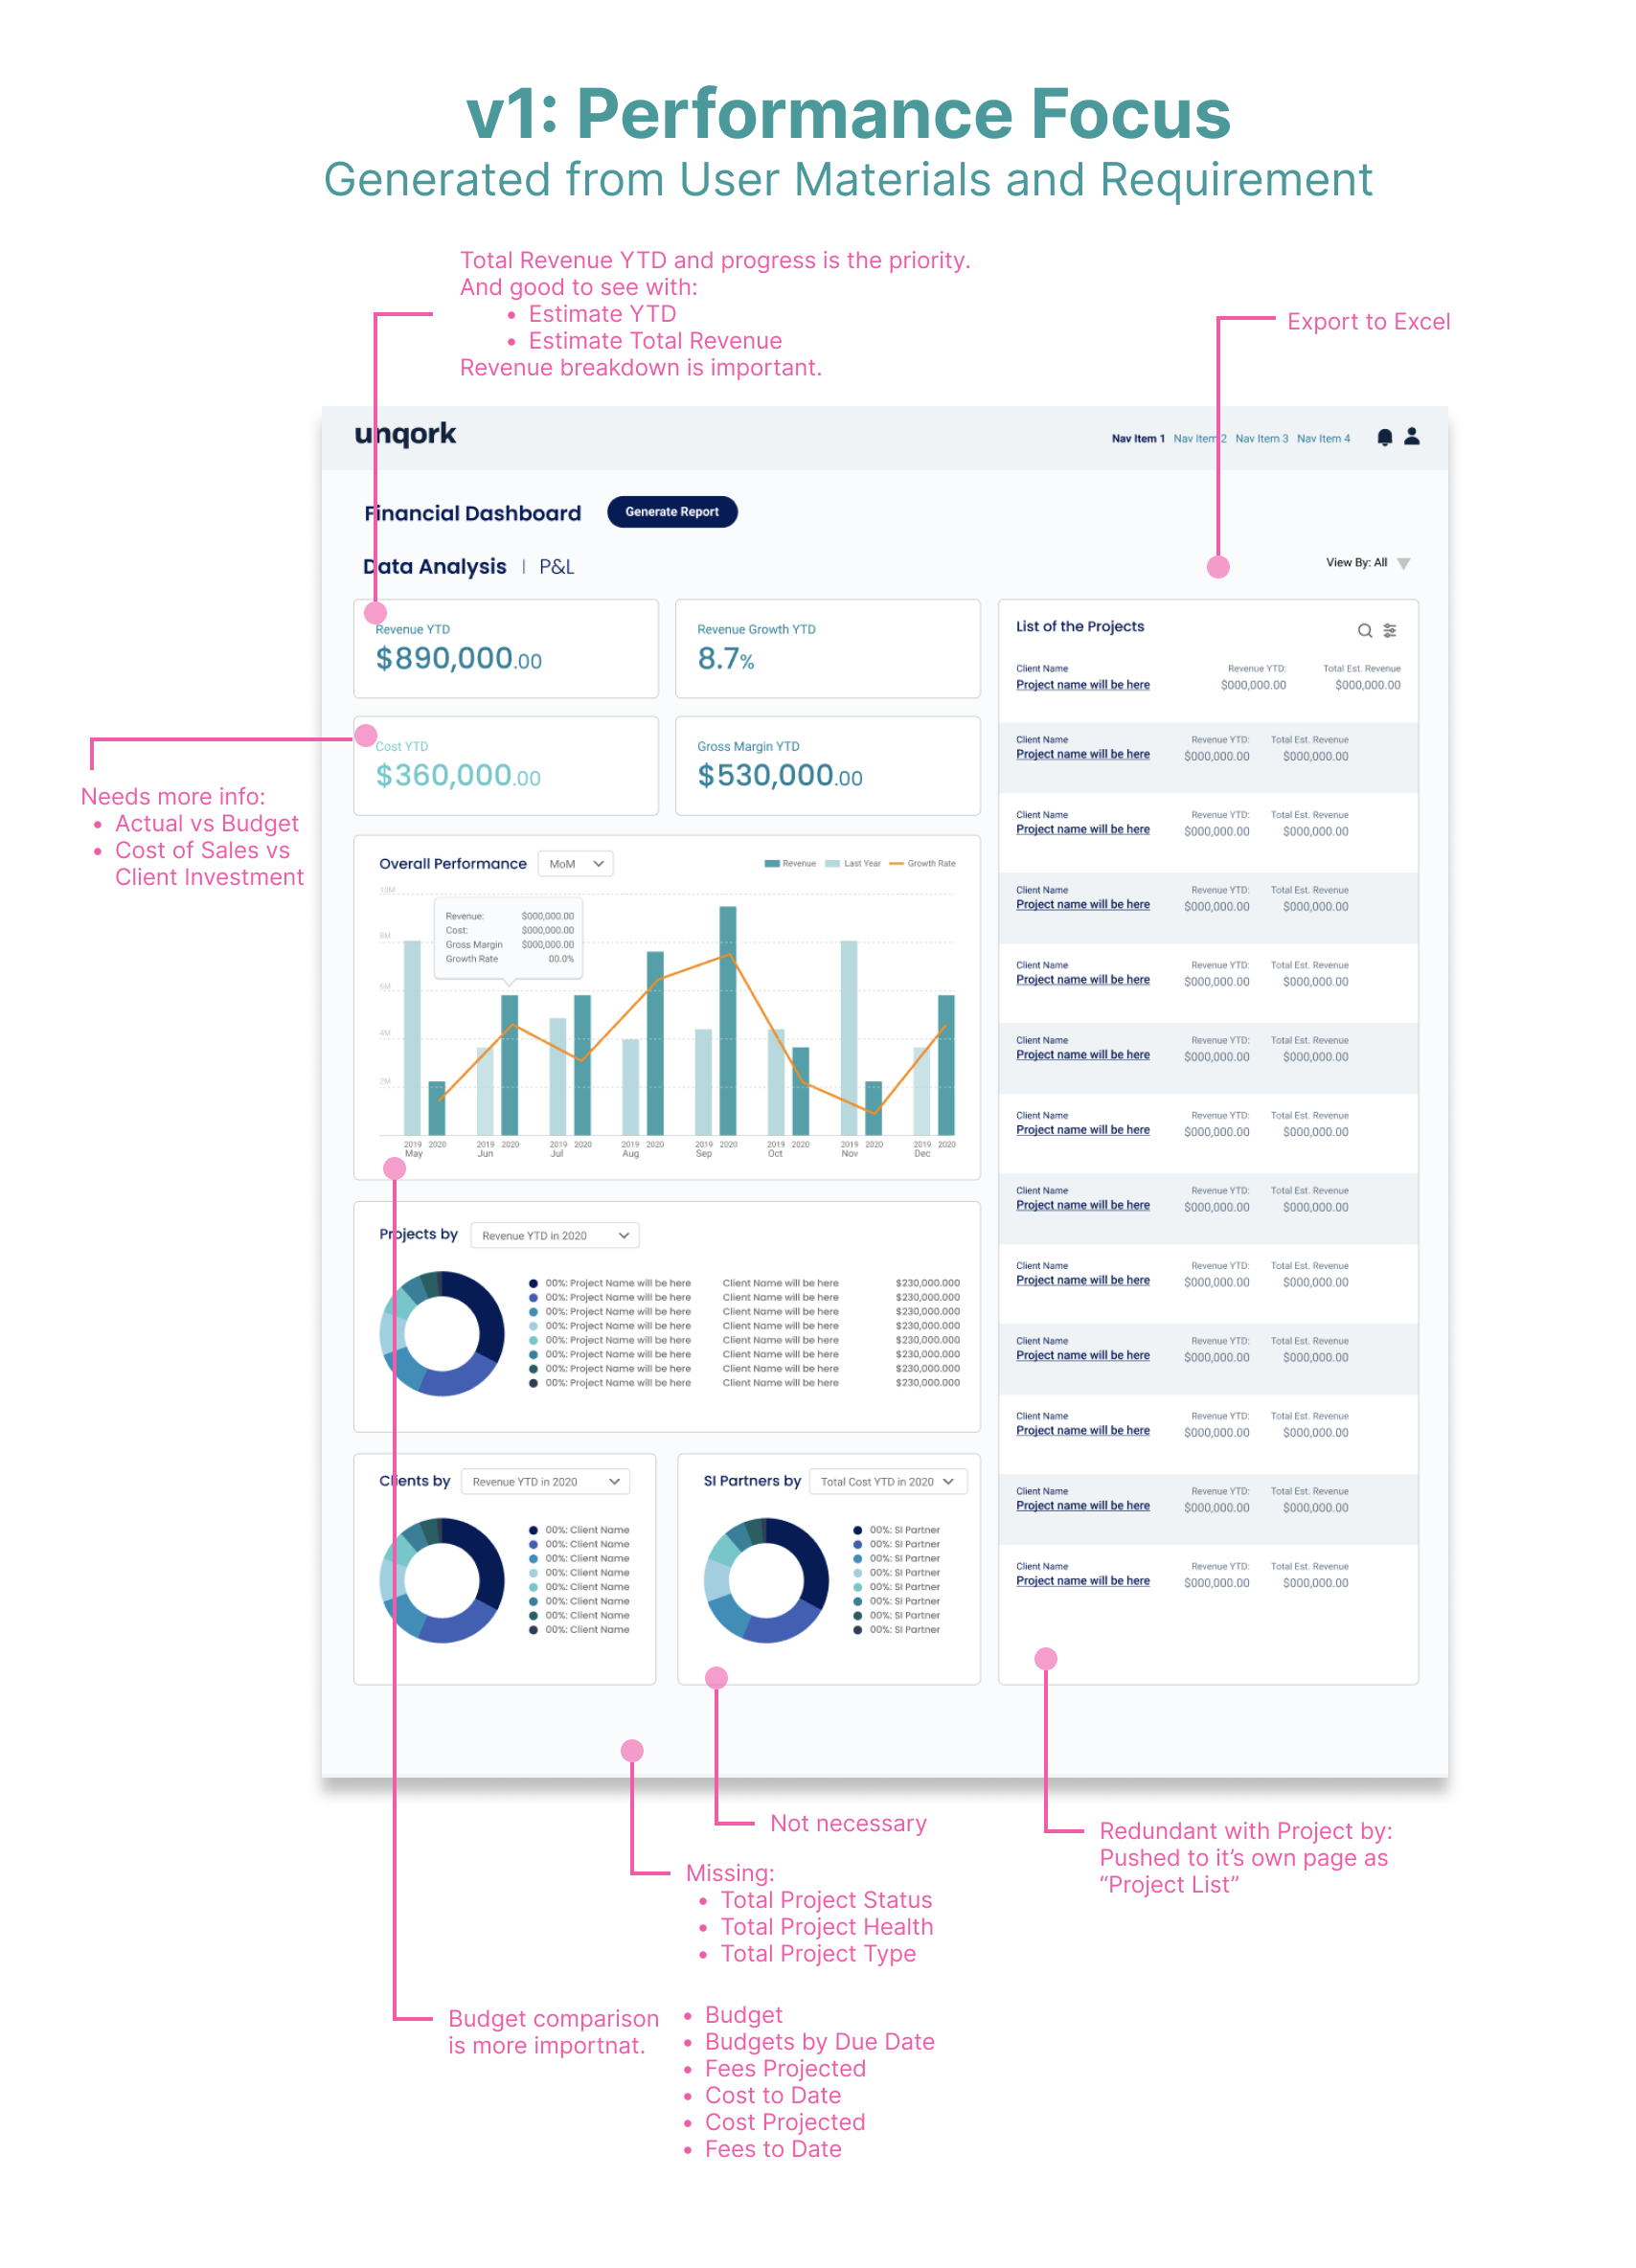
Design Iteration
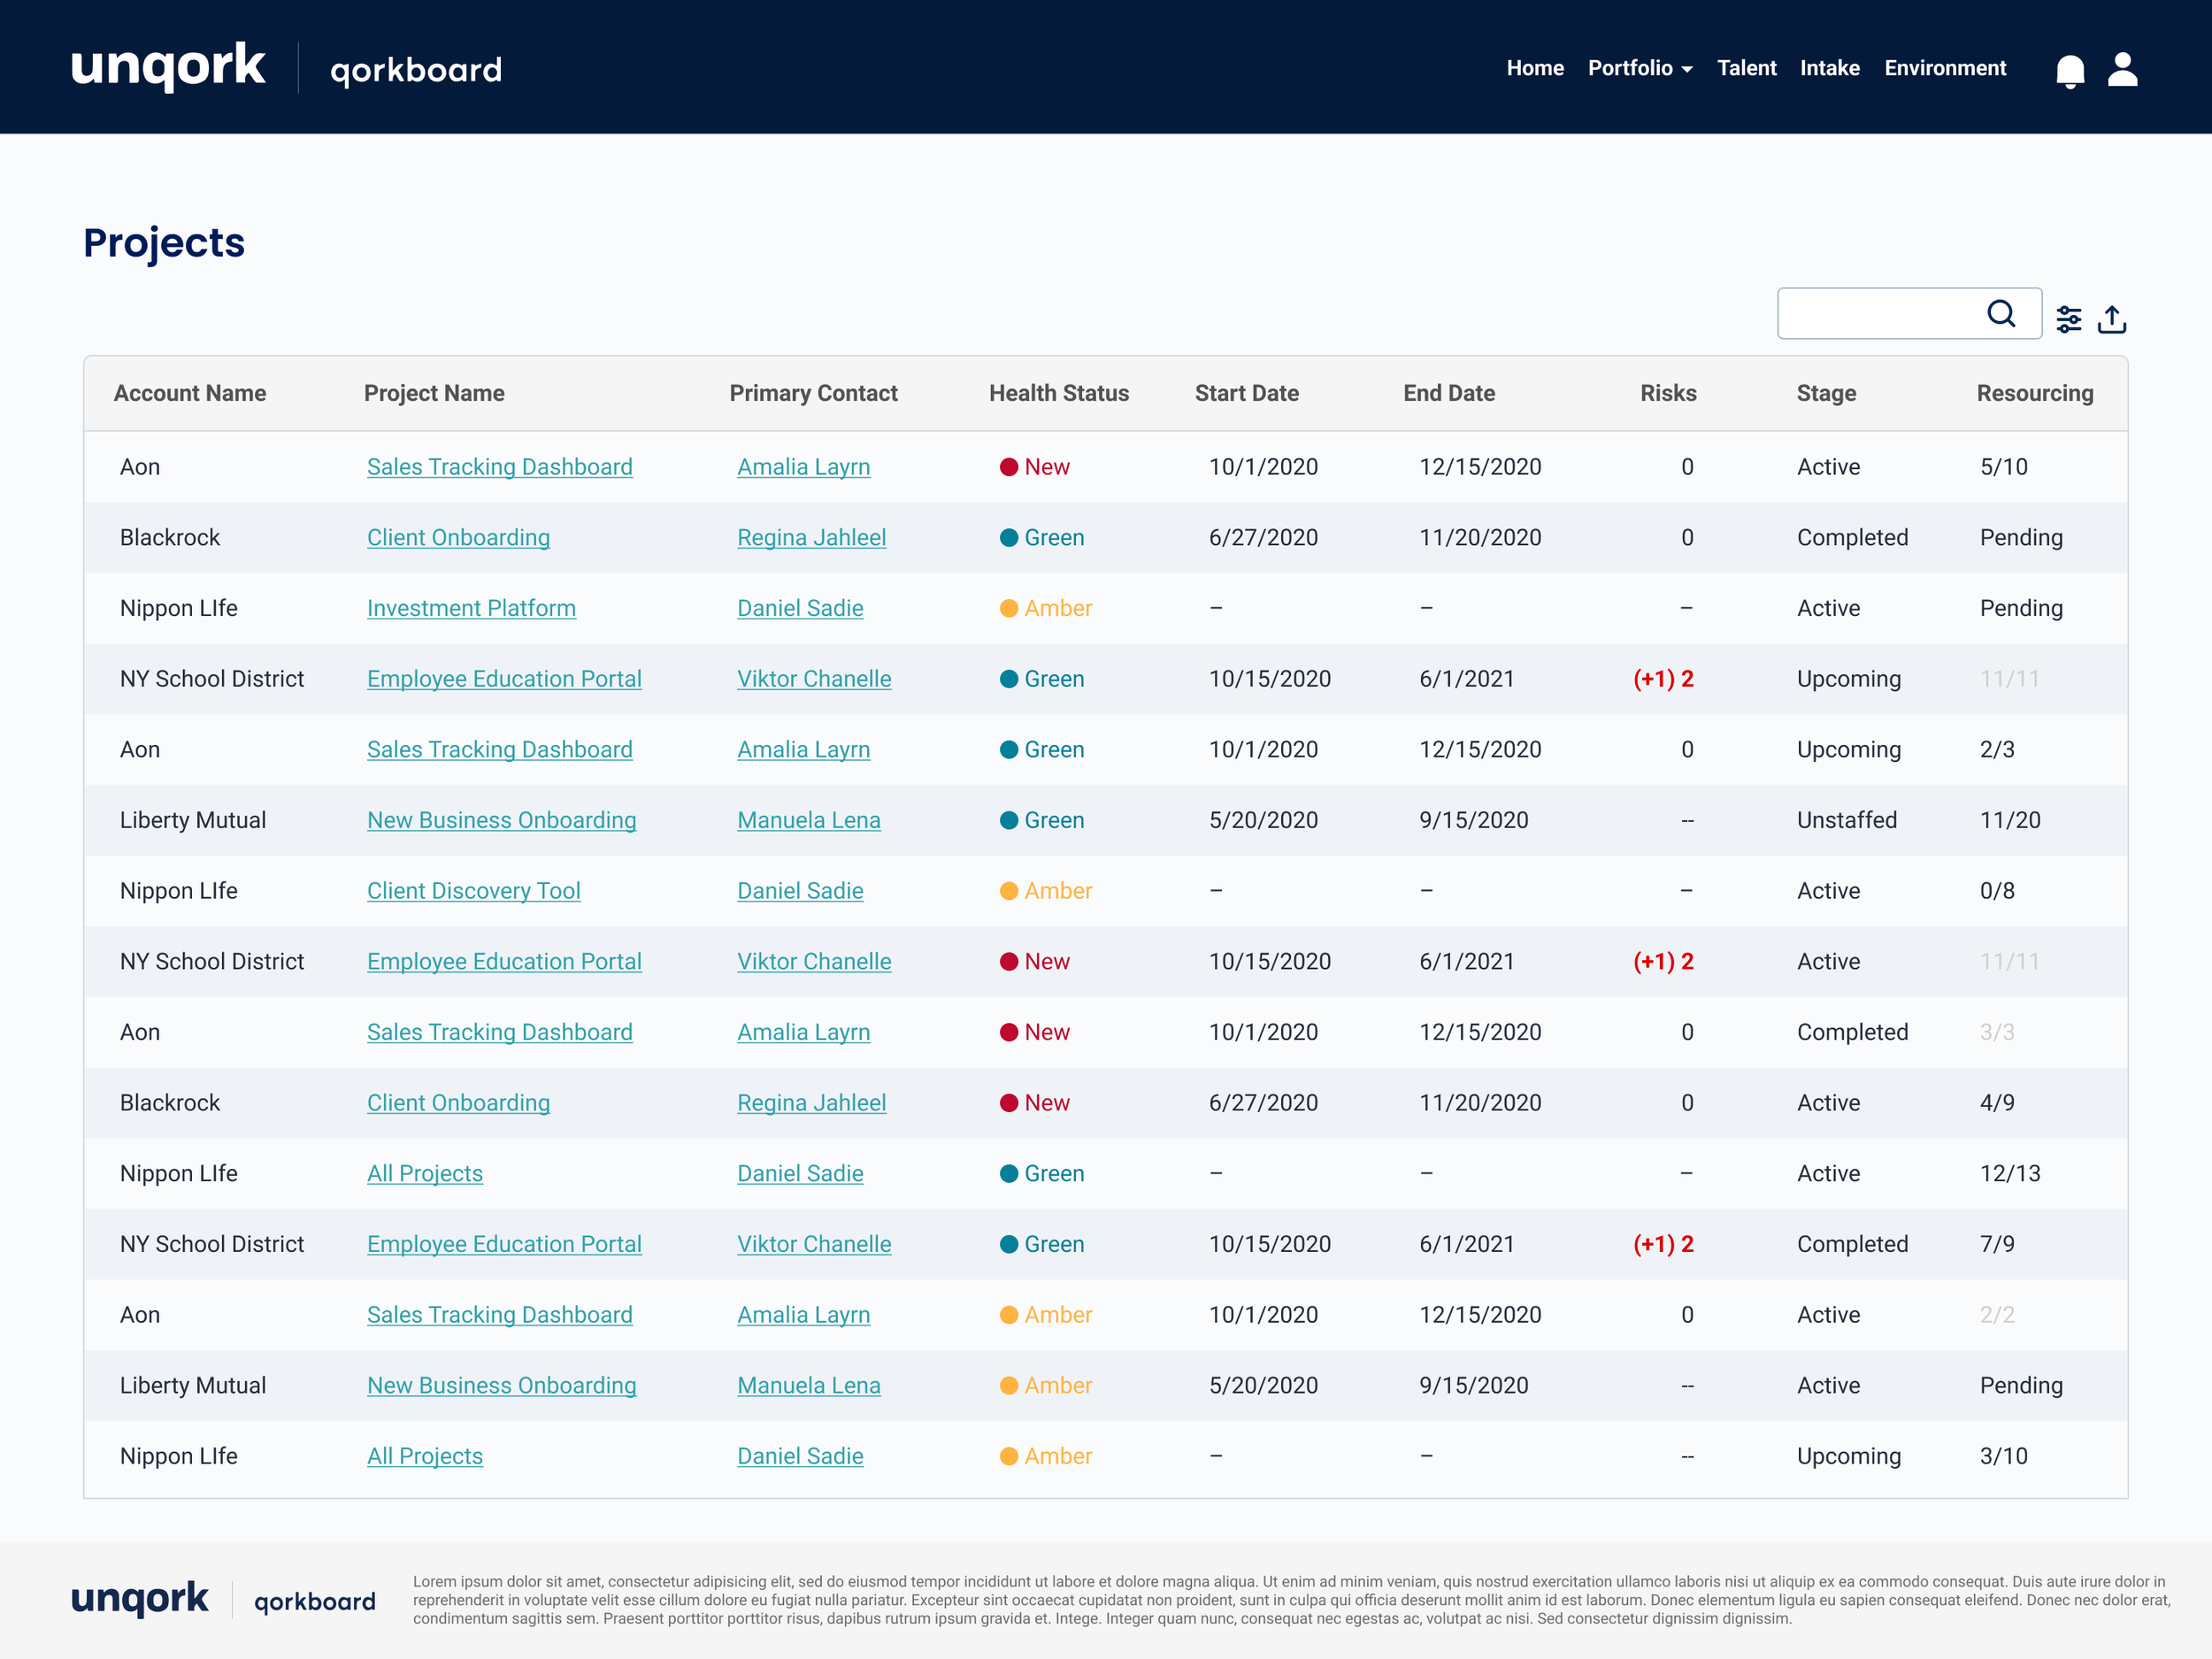
Financial (Portfolio) Analysis


Project Financial Analysis


Final Design
Portfolio Summary / Financial Analysis


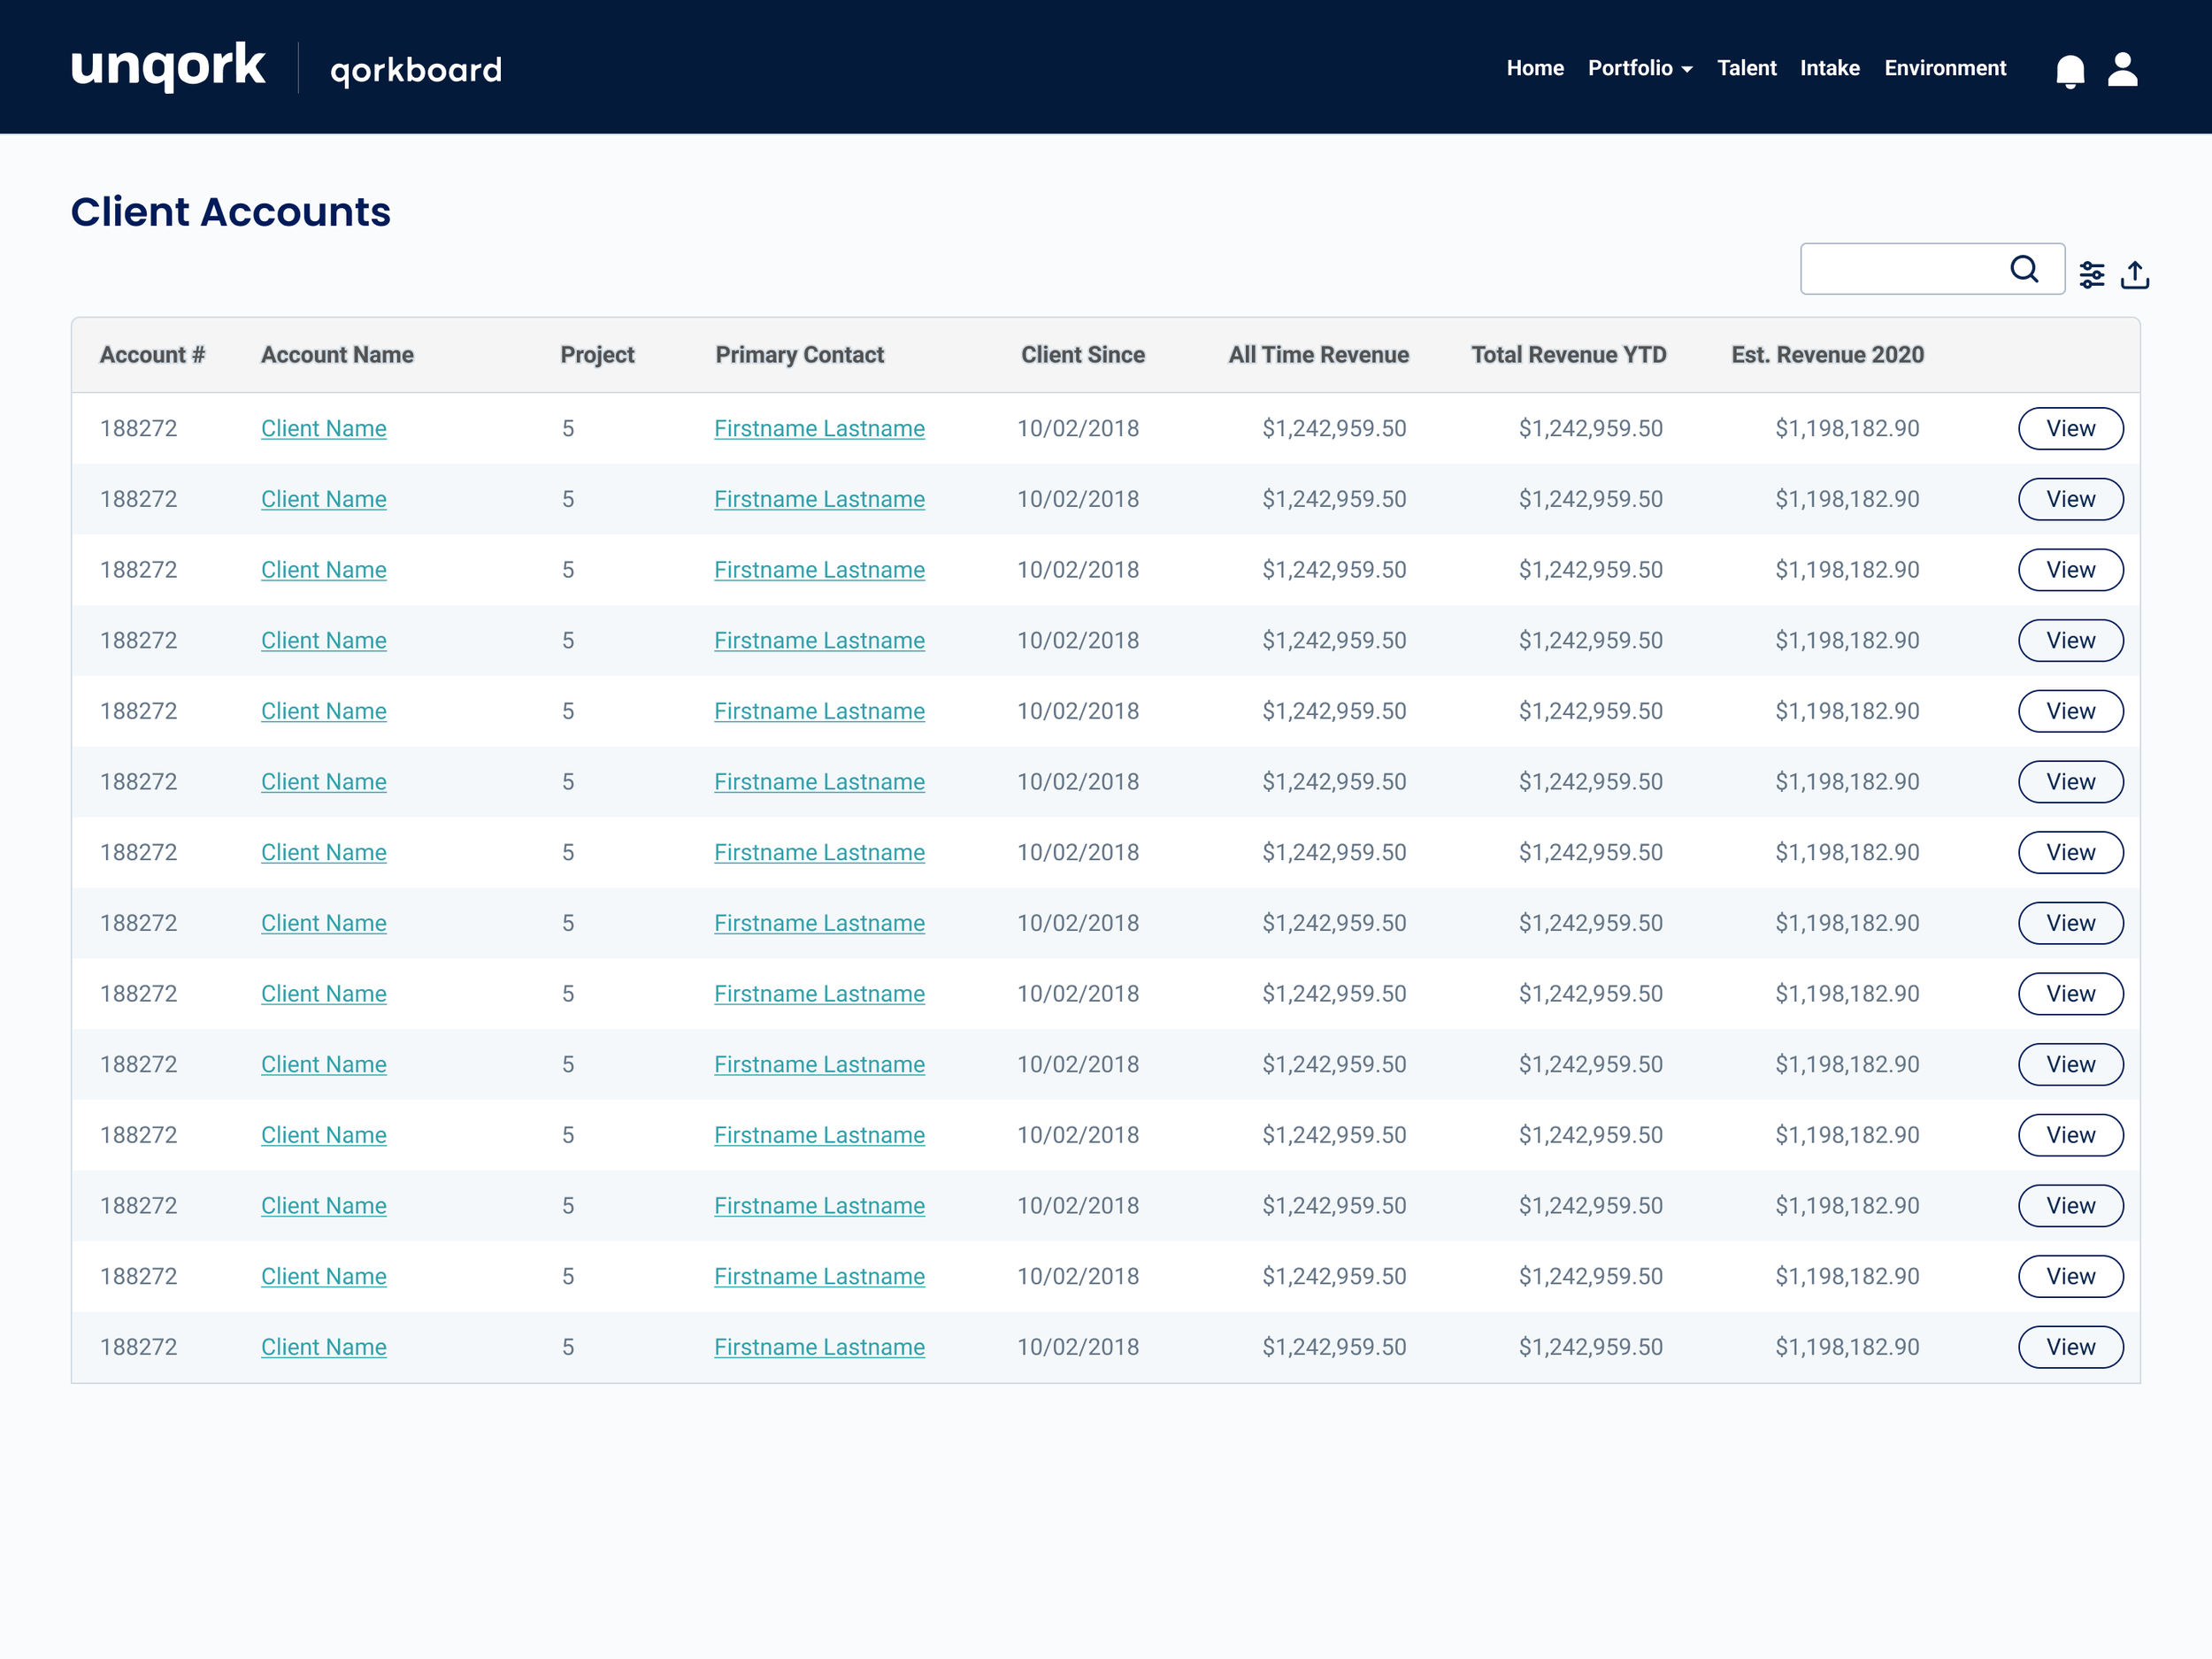
Client (Account) Financial Analysis
Project Financial Analysis


KPI ResuLT
Sus survey result was improved up to 43%. Also, the business was able to cut third-party integration that does not support Unqork system.
Next Steps…
The timeline was too tight for the size of the scope, so content sorting should be executed along with user testing. Also, review all the corner cases with engineers and create design patterns for them.